Monthly Data
June 2026
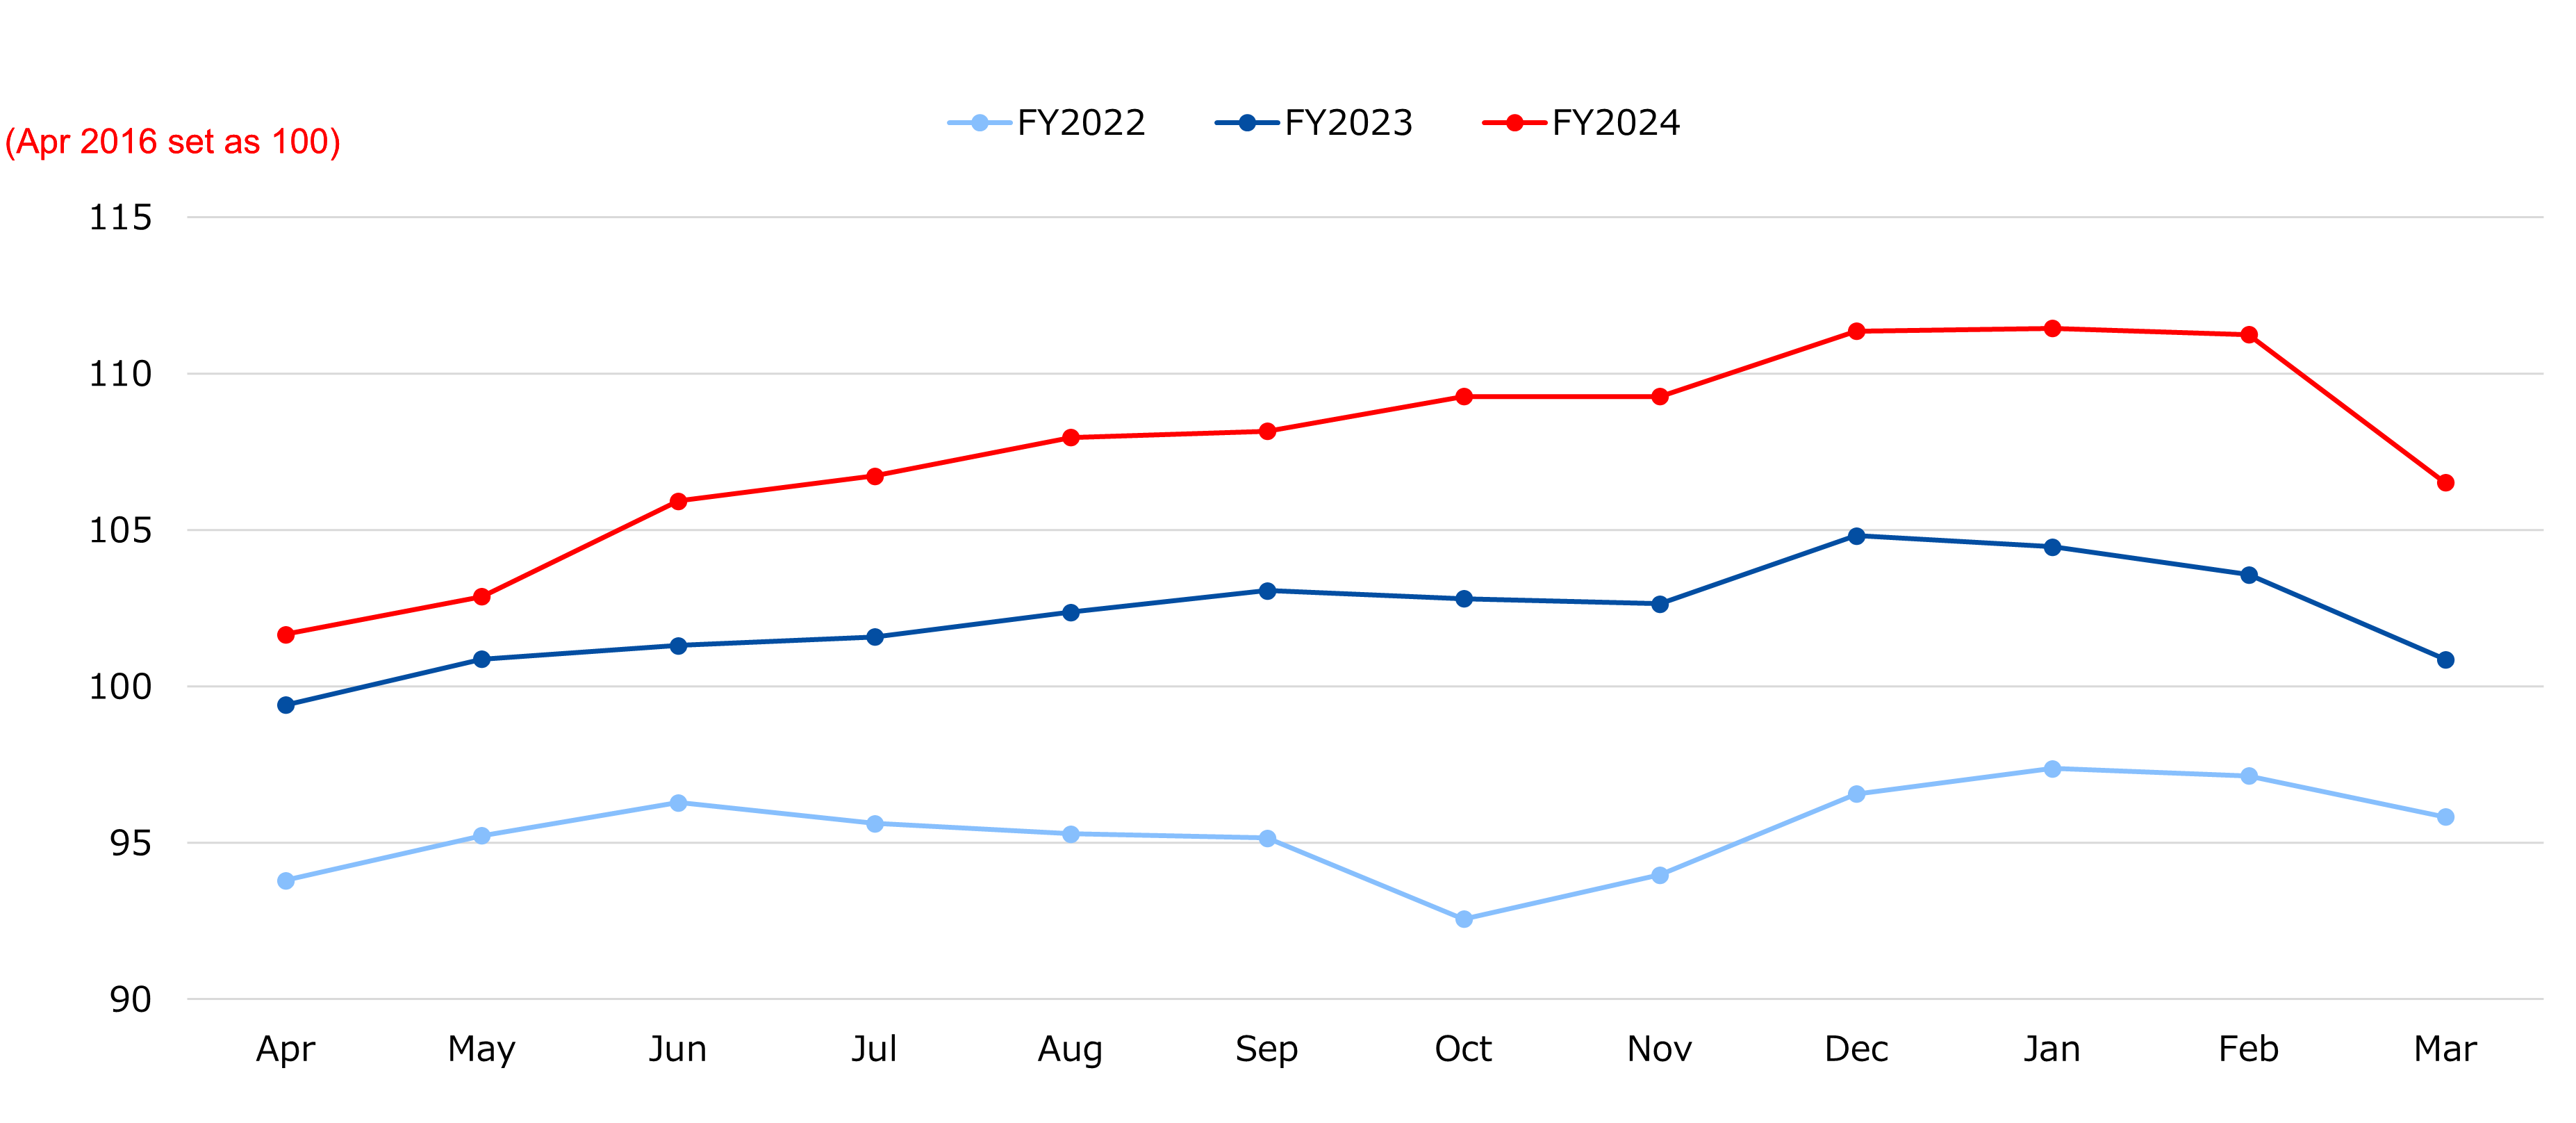
※(Note1) Average unit rent for new contracts(index) is based on the average rent of contracts in April 2016 as 100.
※(Note2) Occupancy rate = Number of rooms rented (excluding the ones for which the settlement procedure is completed following the contract termination) / Number of rooms under management
The numbers are preliminary as of Tuesday, June 30, 2026 and subject to change.
Next monthly data will be disclosed after 3:30 pm, Friday, August 7, 2026.
Average unit rent for new contracts(index)
Occupancy rate(%)
(%)
-
Page access ranking
June 1-30, 2026
-

Leopalace21 is working to solve a wide variety of social issues with the aim of creating a sustainable society under the sustainability vision of "We go on creating new value for society today and in the future."
External Evaluation


-
- Clicking on the link above will take you to the "each evaluation" site.(Japanese language only)
SERVICE SITES


-
- Clicking the links above will take you to the home page of each site.