Environmental Initiatives
Leopalace Green Energy Project
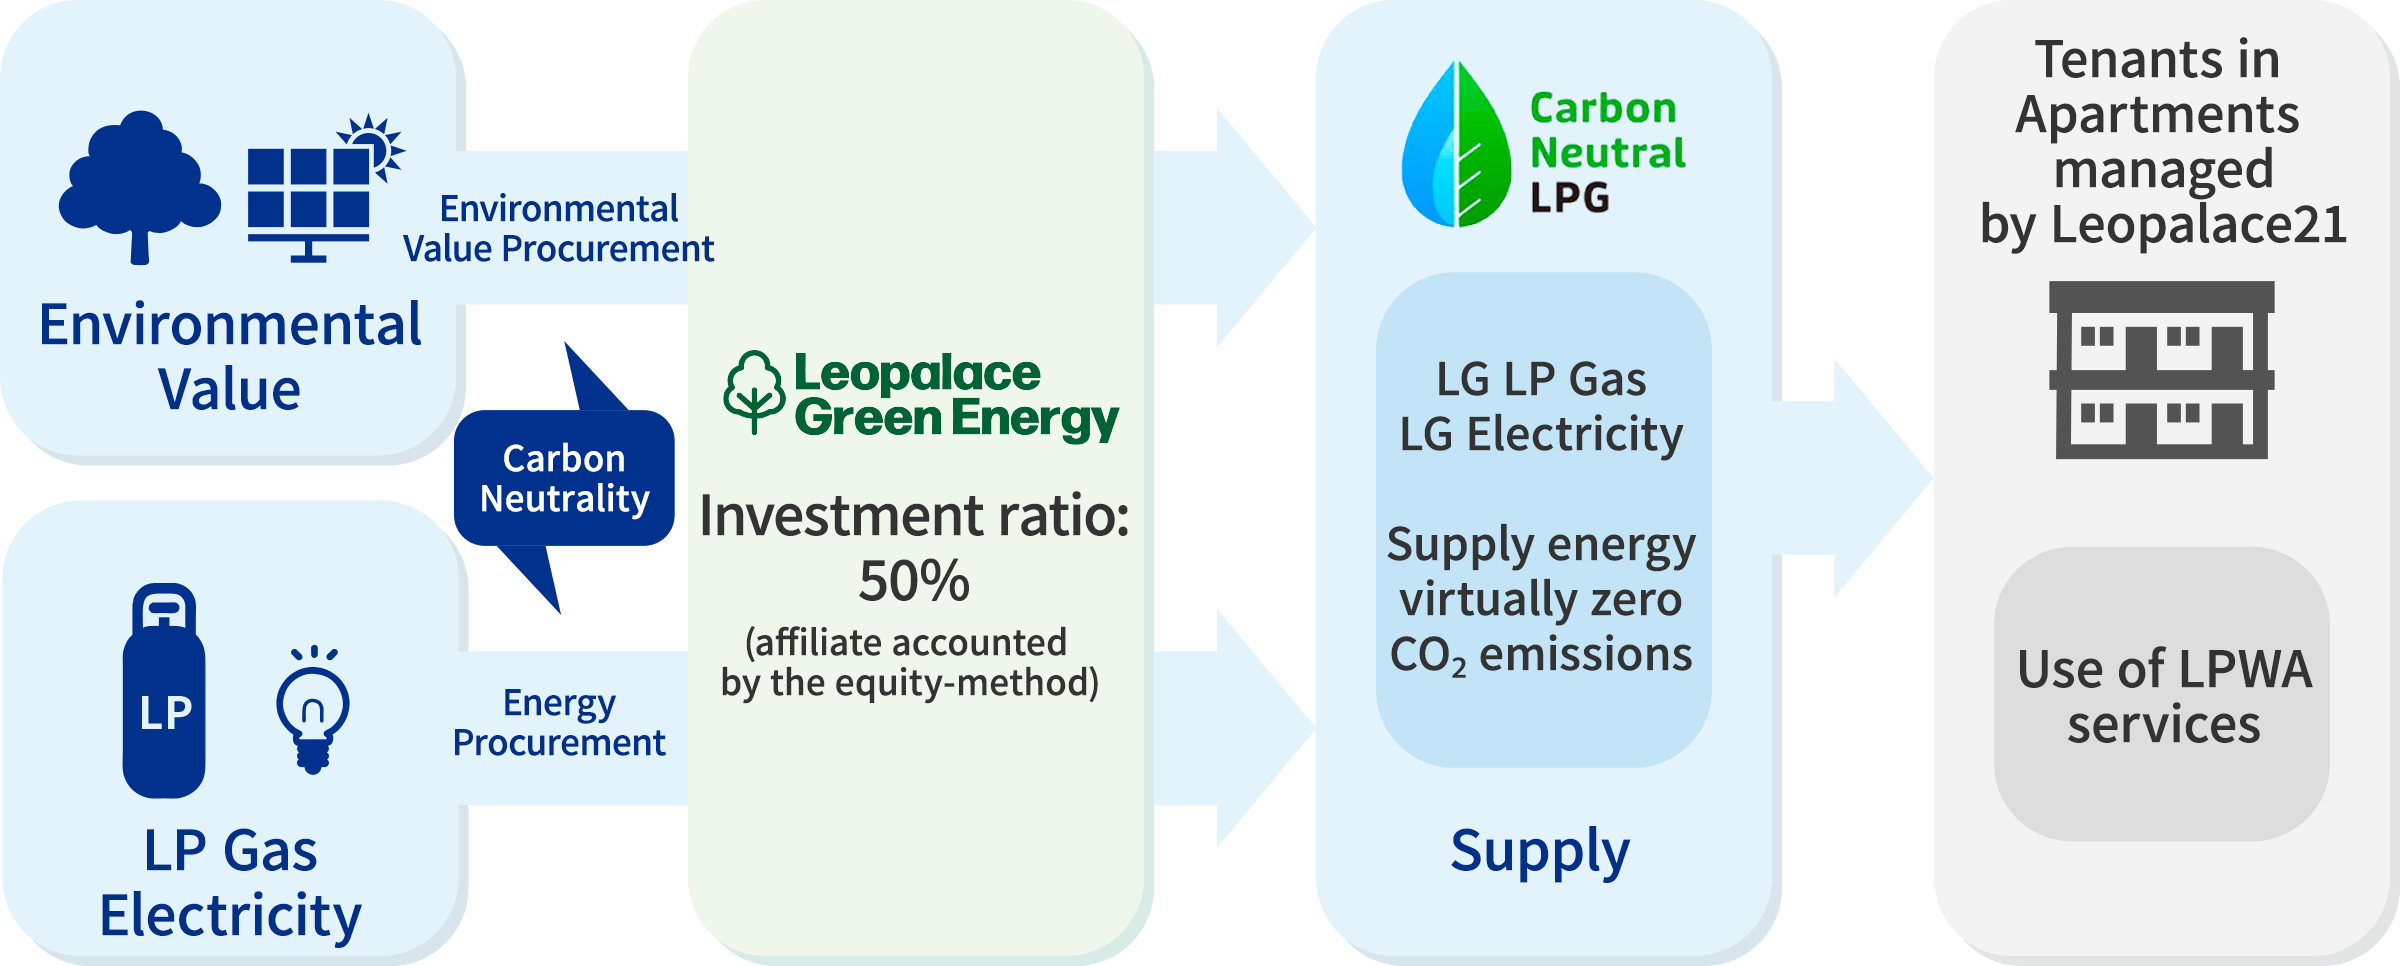
We established Leopalace Green Energy Corporation to contribute to the measures against global warming, improve convenience and safety for tenants, and promote real estate technology. In cooperation with the related companies, Leopalace Green Energy started to provide in 2023 Leopalace Green LP Gas (hereinafter "LGLP Gas"), and utilize LPWA service that enables remote operation of gas meters when using LGLP Gas, for rental apartments managed by the Company. In addition, Leopalace Green Energy began to provide in June 2024 Leopalace Green Electricity (hereinafter "LG Electricity"), which is accompanied by non-fossil certificate and is in effect based on renewable energy resources.
Leopalace Green Energy aims to supply LGLP gas and LG electricity to approximately 400,000 apartment units. When it achieves the targeted number of units, it contributes to reducing CO₂ emissions by approximately 360,000 t-CO₂ per year, which is equivalent to the CO₂ absorption of 25.7 million cedar trees. It offsets the CO₂ emissions resulting from the use of gas and electricity by the tenants, which is approximately 360,000 t-CO₂ per year, hence makes the rental housing with virtually CO₂-Free.
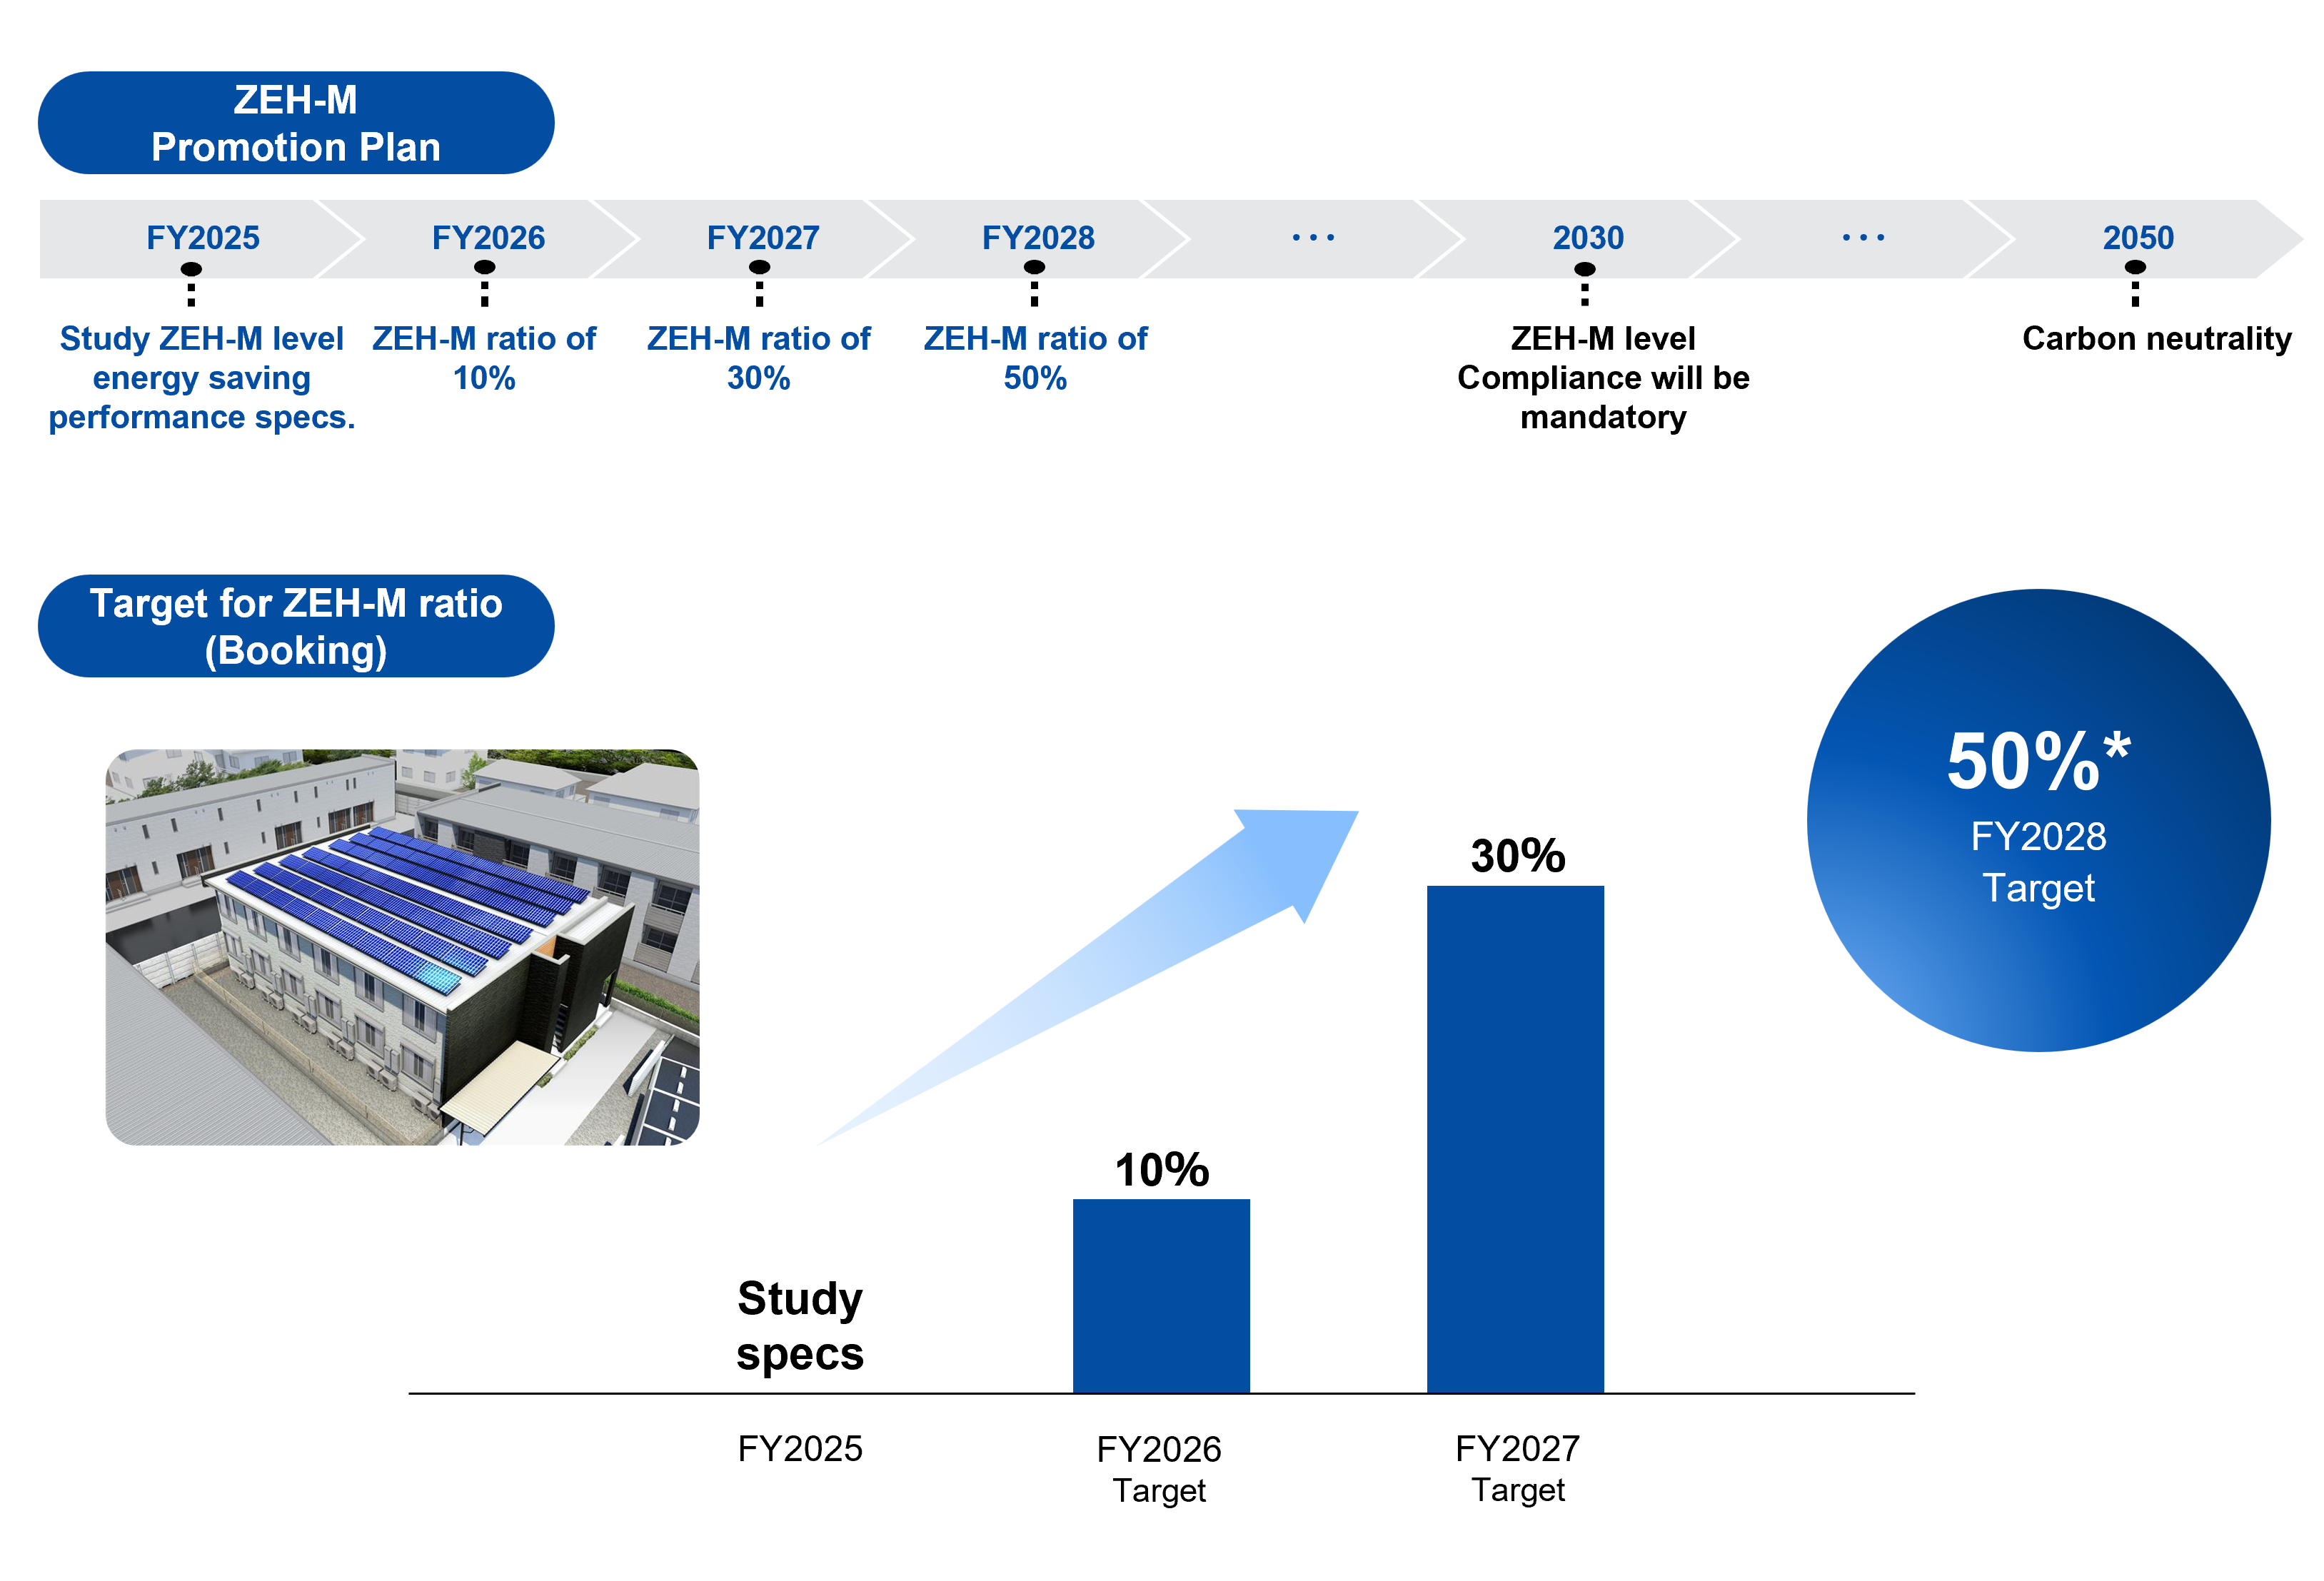
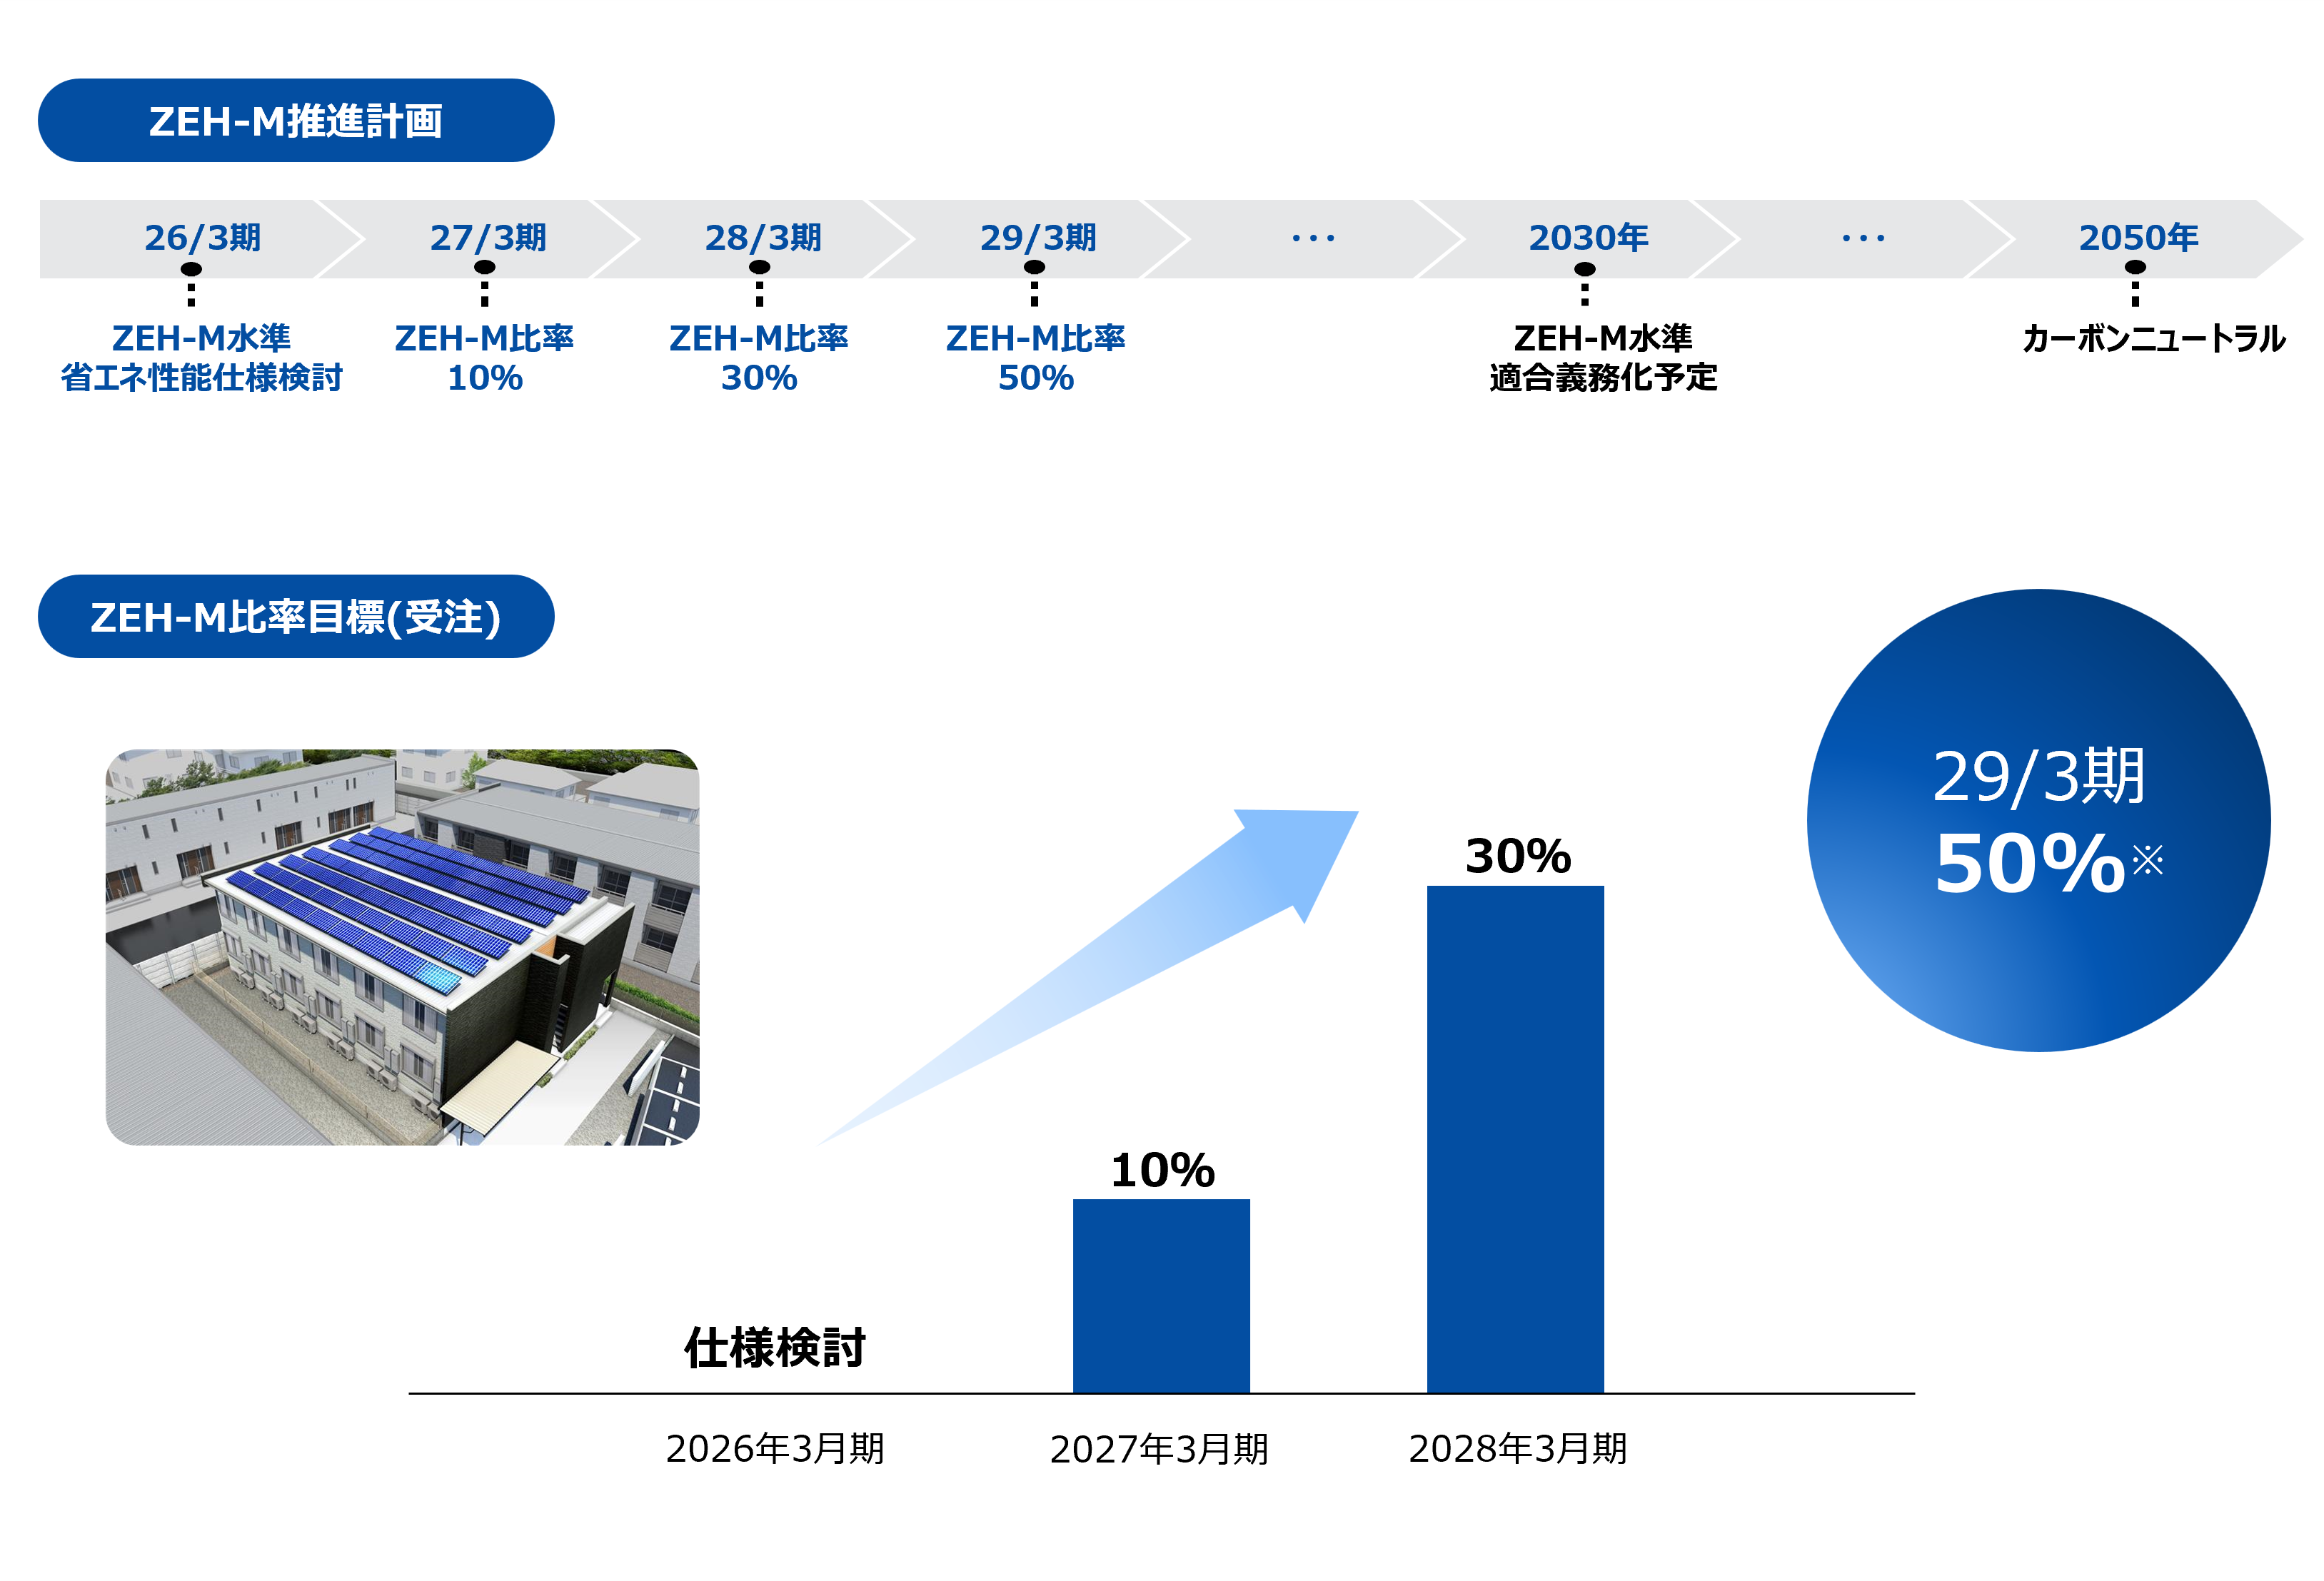
Promote ZEH-M
We promote ZEH-M in addition to current efforts for environmental friendliness: reduction of CO₂ emissions,
energy-saving considerations, and reduction of waste materials.
We completed our study of ZEH-M level energy saving performance specifications by the end of FY2025 and aims to achieve a ZEH-M ratio of 50%* in
construction contracts for FY2028.
[FY2025 Results for the Adoption of ZEH-M in Low-Rise Apartment Building]
Overall ZEH-M: 0%
Ratio of units meeting or exceeding the target standard of Nearly ZEH-M: 0%
[FY2030 Targets for the Adoption of ZEH-M in Low-Rise Apartment Building]
Overall ZEH-M: 100%
Ratio meeting or exceeding the target standard of Nearly ZEH-M: 10%
* Including ZEH-M Oriented equivalent
Contact for inquiries regarding ZEH-M: +81-570-006-021 (Hours: 10:00-18:29)
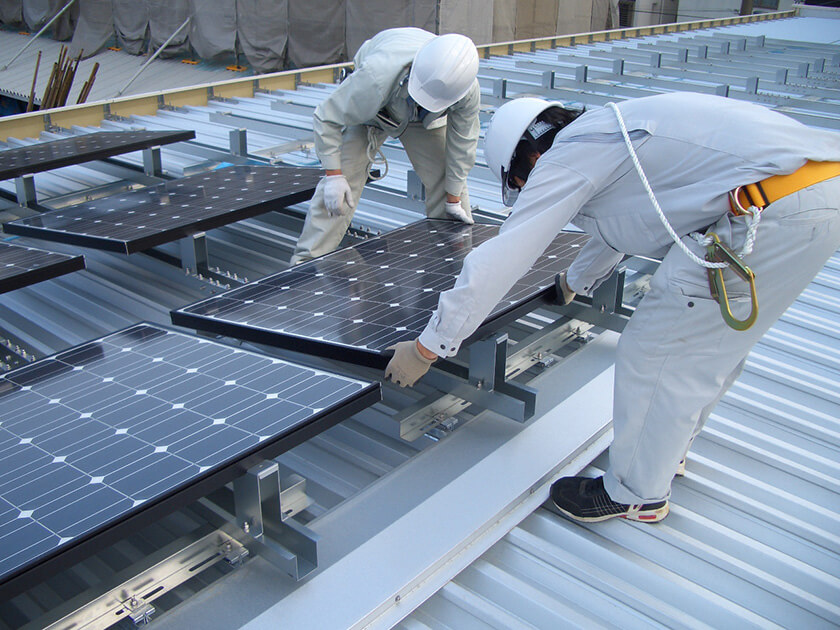
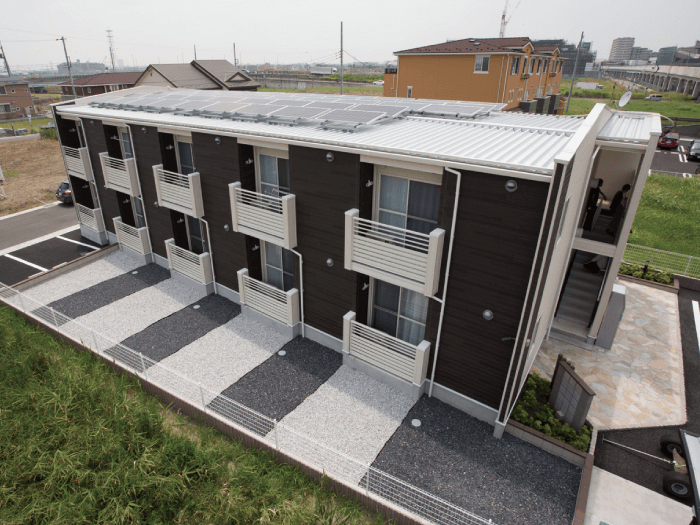
Roof Lease Solar Power Generation Business
We rent the roofs of apartment buildings owned by apartment owners and install solar power generation systems.
The electricity generated is sold through our subsidiary, Leopalace Power Corporation.
SERVICE SITES
-
- Clicking the links above will take you to the home page of each site.